Commonly Used Plotting Functions in the Python-OpenCV Library

Installation and Import of OpenCV in Python

Execute the following pip command to complete the installation of the OpenCV library:

1
pip install opencv-python

After the installation is complete, import the cv2 module:

1
import cv2

cv2.line()

1
2
3
4
5
6
7
8
9
10
11
12
13
14
15
16
17
# cv2.line(img, pt1, pt2, color, thickness, lineType, shift)
# ————Parameter Description————
# img: Specify canvas
# pt1: (x, y)
# pt2: (x, y)
# color: (B,G,R)
# thickness: Line width
# lineType
# shift: Point coordinate accuracy

import cv2
import numpy as np

img = np.ones((300, 300, 3), np.uint8)
cv2.line(img, (100, 150), (200, 150), color=(0, 255, 255), thickness=2)
cv2.imshow('img_name', img)
cv2.waitKey(0)

cv2.circle()

1
2
3
4
5
6
7
8
9
10
11
12
13
14
15
16
17
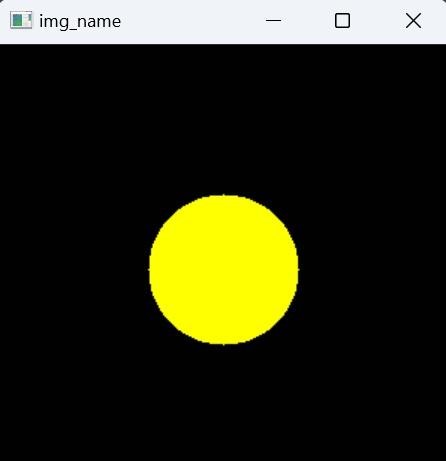
# cv2.circle(img, center, radius, color, thickness, lineType, shift)
# ————Parameter Description————
# img:Specify canvas
# center: (x, y)
# radius
# color: (B,G,R)
# thinkness: Line width, When >0, it represents the thickness of the circular border (in pixels), when <0, it represents a solid circle.
# lineType
# shift:Accuracy of circle center coordinates and radius

import cv2
import numpy as np

img = np.ones((300, 300, 3), np.uint8)
cv2.circle(img, center=(150, 150), radius=50, color=(0, 255, 255), thickness=-1)
cv2.imshow('img_name', img)
cv2.waitKey(0)

cv2.ellipse()

1
2
3
4
5
6
7
8
9
10
11
12
13
14
15
16
17
18
19
20
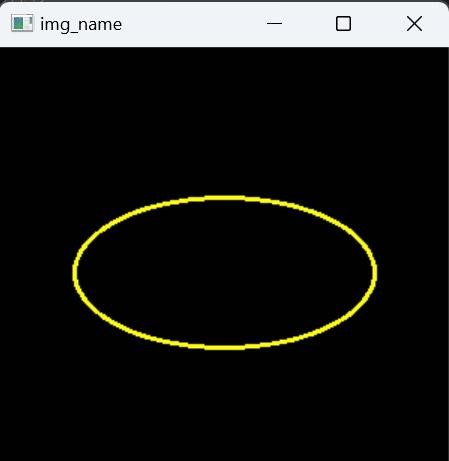
# cv2.ellipse(img, center, axes, angle, startAngle, endAngle, color, thickness, lineType, shift)
# ————Parameter Description————
# img: Specify canvas
# center: (x, y), Ellipse center point coordinates
# axes: Ellipse size (major and minor axis)
# angle: Rotation angle (clockwise)
# startAngle: The starting angle for drawing (clockwise)
# endAngle: The ending angle of the drawing (drawing the entire ellipse: [0,360]; drawing the lower half of the ellipse: [0,180])
# color: (B,G,R)
# thickness: Line width
# lineType: default=8
# shift: Accuracy of center coordinates and axis length (default=0)

import cv2
import numpy as np

img = np.ones((300, 300, 3), np.uint8)
cv2.ellipse(img, (150, 150), (100, 50), 0, 0, 360, (0, 255, 255), 2)
cv2.imshow('img_name', img)
cv2.waitKey(0)

cv2.rectangle()

1
2
3
4
5
6
7
8
9
10
11
12
13
14
15
16
17
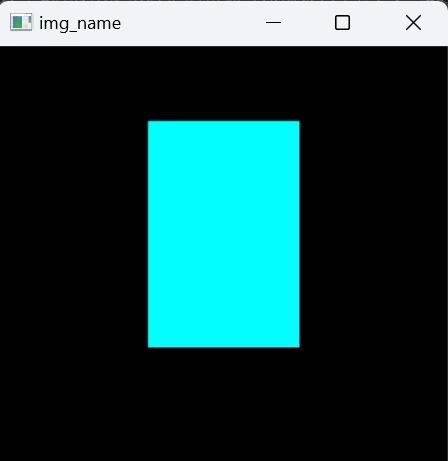
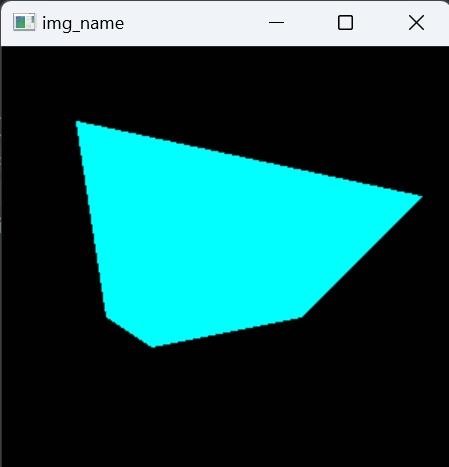
# cv2.rectangle(img, pt1, pt2, color, thickness=None, lineType, shift)
# ————Parameter Description————
# img: Specify canvas
# pt1: (x, y),Point coordinates of the upper left corner of the rectangle
# pt2: (x, y),Point coordinates of the lower right corner of the rectangle
# color: (B,G,R)
# thinkness: Line width, When >0, it represents the thickness of the rectangular border (in pixels), when <0, it represents a solid rectangle.
# lineType
# shift: Point coordinate accuracy

import cv2
import numpy as np

img = np.ones((300, 300, 3), np.uint8)
cv2.rectangle(img, (100, 50), (200, 200), (255, 255, 0), -1)
cv2.imshow('img_name', img)
cv2.waitKey(0)

cv2.polylines()

1
2
3
4
5
6
7
8
9
10
11
12
13
14
15
16
17
18
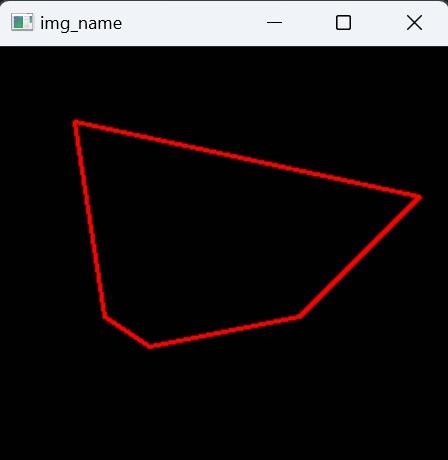
# cv2.polylines(img, pts, isClosed, color, thickness, lineType, shift)
# ————Parameter Description————
# img: Specify canvas
# pts: (x, y),point set
# isClosed: Whether the multiple line segments drawn are closed. True means closed and will connect the first and last points.
# color: (B,G,R)
# thickness: Line width
# lineType: default=8
# shift: Point coordinate accuracy

import cv2
import numpy as np

img = np.ones((300, 300, 3), np.uint8)
pts = np.array([[50, 50], [70, 180], [100, 200], [200, 180], [280, 100]], np.int32)
cv2.polylines(img, [pts], True, (0, 0, 255), 2)
cv2.imshow('img_name', img)
cv2.waitKey(0)

cv2.fillPoly()

1
2
3
4
5
6
7
8
9
10
11
12
13
14
# cv2.fillPoly(img, pts, color)
# ————Parameter Description————
# img: Specify canvas
# pts: (x, y),point set
# color: (B,G,R)

import cv2
import numpy as np

img = np.ones((300, 300, 3), np.uint8)
pts = np.array([[50, 50], [70, 180], [100, 200], [200, 180], [280, 100]], np.int32)
cv2.fillPoly(img, [pts], (255, 255, 0))
cv2.imshow('img_name', img)
cv2.waitKey(0)

cv2.putText()

1
2
3
4
5
6
7
8
9
10
11
12
13
14
15
16
17
18
19
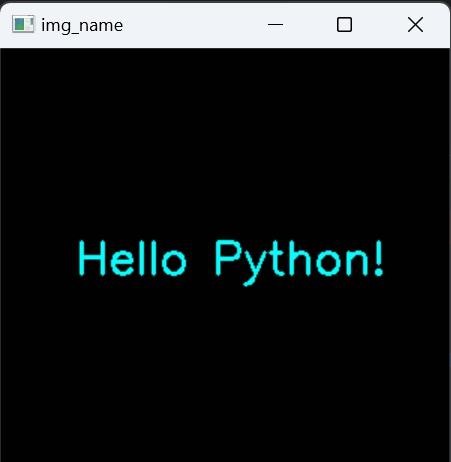
# cv2.putText(img, text, org, fontFace, fontScale, color, thickness, lineType, bottomLeftOrigin)
# ————Parameter Description————
# img: Specify canvas
# text: Text content
# org: The drawing position, which is the coordinate of the lower left corner of the text string
# fontFace: Font type
# fontScale: Font size
# color
# thickness
# lineType: Boundary type
# bottomLeftOrigin: true/false. If true, the origin is in the lower left corner of the text image, otherwise it is in the upper left corner; if set to true, the text will be upside down, and the default is false.

import cv2
import numpy as np

img = np.ones((300, 300, 3), np.uint8)
cv2.putText(img, 'Hello Python!', (50, 150), cv2.FONT_HERSHEY_SIMPLEX, 1, (255, 255, 0), 2)
cv2.imshow('img_name', img)
cv2.waitKey(0)

cv2.imshow()

1
cv2.imshow('img_name', img)

cv2.waitKey()

1
cv2.waitKey(delay_time)

Usually you need to use waitKey() after imshow(). waitKey(0) means waiting until any key is pressed, and waitKey(n) means delaying n milliseconds to close the window.